I’ve made a dead horse of the old adage, “Rob Peter to pay Paul.” In truth, neither are totally at fault. The government has been collecting less, spending more, and running up the debt. Today’s debate about spending cuts and the budgeted deficit are not close to solving the problem, and if nothing is done entitlement spending alone will bankrupt the country. On the bright side, the public and the government have recognized the problem. It may be recession and the plight of state’s budgets that has forced recognition.
Lets take a quick look at the recession to see if you are justified in feeling so glum about the economy.  First note that annual GDP growth went negative for the first time in 60 years. Also observe that from 1950 to 1980 the trend in GDP growth was positive. Since 1980, the trend has been negative. This is very serious because GDP measures how robust the country’s economy is. Growth was mostly flat in the 90’s, which may have lulled us into thinking that things were swell, but until the trend turns positive, it will be hard sustain the life style we would like to become accustom to. First note that annual GDP growth went negative for the first time in 60 years. Also observe that from 1950 to 1980 the trend in GDP growth was positive. Since 1980, the trend has been negative. This is very serious because GDP measures how robust the country’s economy is. Growth was mostly flat in the 90’s, which may have lulled us into thinking that things were swell, but until the trend turns positive, it will be hard sustain the life style we would like to become accustom to.
Another look at the depth of the recession can be seen in the continuing high unemployment.  More people are unemployed than in previous recessions, and they are staying jobless longer. This is compounded by higher paid manufacturing jobs are being replaced by lower paid service jobs. So, the worst recession ever drives income down and spending up just when the opposite is needed. Does this seem odd when US corporations profits are reaching record highs? More people are unemployed than in previous recessions, and they are staying jobless longer. This is compounded by higher paid manufacturing jobs are being replaced by lower paid service jobs. So, the worst recession ever drives income down and spending up just when the opposite is needed. Does this seem odd when US corporations profits are reaching record highs?
There has been a tight link between increased corporate earnings, profit, and job growth. That link is no longer confined to the US. Many large businesses find close to half their sales offshore. We all want to buy low and sell high or at least more, and that is what American corporations are doing in the emerging economies of the world, where their sales and number of employees are growing. Scoff at the phrase, “globalization”, but it is the reality. Increasing US competitiveness is the only lasting way to increase US GDP and high paid employment.
Little is said about why we should lower Federal Debt, it just seems that we should. The high level of debt forces high interest payments. It forces additional borrowing when loans must be paid back, and it causes higher interest rates when seeking new loans. This all reduces the government’s flexibility in dealing with resource and Geo-political crisis. It constrains spending that will improve our national infrastructure and increase our global competitiveness.
The bullet must be bitten, and it won’t feel good. Federal income must increase and federal spending must decrease. US competitiveness must increase in high value products and services. If not, the negative trend in GDP won’t reverse. The high paying employment picture won’t improve, and the American life style won’t be what mom and dad remember.
[print_link]
We “rob from Peter to pay Paul.” The last post looked at Peter as a source in income, and now we will look at Paul and what we spend on him. It won’t take long. A quick look at the data makes it clear where cuts must occur, but the problem is making the cuts. We don’t pass a day in the news without hearing the Republicans wanting to cut $100B and the Democrats $33B from Discretionary Spending. Go back and look at the second chart in the first post. Non-Military Discretionary Spending is 13.5% of the total spending budget. Cut it all and the deficit problem is not solved.
Lets look closer at spending. The next two charts are taken from the Heritage Foundation report, “Federal Spending By The Numbers 2010.” The Foundation is a conservative organization, but their data is sourced from government agency reports.
 2010 Spending categories Click the chart to enlarge. The top ten categories ending with Education make up 88% of the budget. Any discussion about spending cuts that will seriously reduce the Deficit must be in these ten categories. The rest is, as an acquaintance says, “mice nuts.”
I will get to Social Security, Medicare, and Medicaid next, but first consider National Defense. This is a discretionary category that remains untouched. One might ask if we need military stationed in Europe or Okinawa? Do we need new advanced aircraft carriers, submarines, nuclear missiles, or stealth fighters? It seems that future wars will be cyber or gorilla in nature, and it looks like we are enhancing a military for the past. No doubt there is room to cut, and no doubt it is politically painful. Remember, budget cuts always cost jobs and cash flow in someone’s neighborhood.
Moving on to the three big entitlements, the next chart shows the source of worry. Left to grow untouched, Entitlement spending will consume all federal income in the next forty years. There will not be one dollar available for any other category of spending.
 Entitlement Spending Projections What can I say? These still remain the “third rail” of politics — too dangerous to touch. But, it will happen, and the longer we wait, the worse it will be.
Social Security gets considerable political attention. It has both short and long term problems. Last year was the first since 1984 that its income was less than its expenses. Not a problem, SS has a very large trust fund, but most of it has been loaned to the government general fund. SS will have to start calling its IOUs, and this is the short term problem for the federal deficit. The longer issue is that the trust fund reaches zero in 2037. Then benefits will have to be reduced as much as 22% to balance the SS budget. The solution rest in increasing the tax base, lowering cost of living increases, and extending retirement age. These are easy fixes compared to Medicare finances, which I have not taken time to understand.
So you see the problem, borrow more, tax more, and/or spend less. Borrowing more is becoming less acceptable. The public is getting wise, and the cost of borrowing is increasing. Increased taxing is still too tied to political ideology. Spending cuts, well we have not yet answered the reality issue. Is continued spending growth in Military, SS, Medicare, and Medicaid preparing the country for future economic competitiveness or dragging it down? I will wrap up this study in one concluding post.
[print_link]
I’ll start with Income instead of Spending. You have to have it before you can spend it, at least you should have. Each of us is both Peter and Paul. I receive Social Security, use libraries, and drive on public roads, while paying income tax and other taxes. For now I will focus on Peter and taxes. The Federal Government only taxes the flow of money (income, profits, and some spending). It doesn’t tax static assets like savings and property, but states tax property. The question is, where is the taxable income, how much can it be taxed, and at what point will taxing today’s personal income begin to reduce tomorrow’s Federal income. This last point gets the most debate; for instance, will extending tax breaks for the rich stimulate the economy or not?
 Office of Management and Budget, Table 2.3 Where is the taxable income? The Income as % of GDP chart is important. It shows that Federal Income has maintained at about 18% of GDP. When GDP grows, Income grows. This is why the government is so motivated to improve the economy. If GDP were to grow an additional half percent, it would generate an additional $125 billion income. Not enough to solve the deficit problem. The deficit is too big to grow out of. So, lets tax more.
 Office of Management and Budget, Table 2.3 The Income Source chart shows how the source of income has changed over the years. Personal Income Tax has continued to provide about 40% of the total, while the Corporate Tax share has decreased. Further, the Social Tax share has increased. This is Social Security and Medicare/Medicaid. Note that since 2000 Income has decreased from 20% of GDP to 15%. This will have to reverse.
Give this some thought, the population has increased and resulted in more income tax payers. But, Baby Boomers are retiring at a growing rate. This means the high income earners are being replaced by lower income earners, resulting in lower income tax. I will leave the impact of this up to your analysis, but lets look at the tax payers.
 Data Source: IRS, Table 2. Returns with Modified Taxable Income The number of tax returns peak at about 18 million in the $50k to $75k range. This distribution looks healthy, dropping off quickly in both directions. It would be less healthy if there was a high income peak and a low income peak with the gap in between showing the difference between “haves” and “have-nots”. Looks are deceiving, there are wider ranges at the top. There are twice as many tax returns below $75K as there are above. We can conclude that the most votes are in the lowest income ranges also. Now, where is the most Federal income earned? The greatest tax income ($230 billion) comes from the $100k to $200k range. A little math shows that those returns above $75k equal 4.5 times the tax revenue of those below. The wealthy provide more of the Income tax revenue than the less wealthy.
But, what about Social Security and Medicare Taxes? The line showing tax as a percentage of income includes these social taxes. The dip to 14.5% occurs in 2007 because S.S. tax was not paid on earned income above $97,500. The Social Taxes are estimates based on the tax rates and include the employer matching contribution, because the employer contribution could have been personal income if not collected as tax. It’s hard to make estimates in the high income ranges because Social Taxes are collected on earned income, not interest and dividends. The next chart shows the sum of a personal taxes, and it’s clear that the mid income ranges contribute the most.
 Data Sourge: IRS, Table 2. Returns with Modified Taxable Income Back to the original questions, where can we tax more? Eliminate the limit on Social Security taxable income. Professional athletes would have to pay S.S. tax through the year beyond their first $106,800 of earnings. It’s hard to argue that those earning more than $200,000 can’t afford to pay more, and it may be accomplished by making the Medicare tax rate progressive instead of fixed at 1.45% in addition to increasing high income tax rates. Will increased taxes dampen the economy and slow job growth? That risk has to be balanced against the need to balance the budget and reduce the deficit.
What about corporate taxes? No more charts, US corporate income tax ranges from 15% to 35% of taxable income, and Colorado corporate taxes are 4.63%. So, a sizable business in Colorado pays about 40% tax compared to about 25% in China. US corporate taxes are the highest in the world. Others are in the area of 30%. Corporate taxes throughout the world are very complex, but the point is clear: 40% vs 25%. There isn’t much more Federal or state income to be extracted from corporations without hurting their competitiveness and US economy.
In the next post I will look at spending.
[print_link]
Lets start by looking at what is a reasonable amount of National Debt. I have to introduce GDP (Gross Domestic Product), and then show Debt as a percent of GDP. GDP is the total goods and services produced within a country in a year. It is the economic measure used to compare countries and judge the health of an economy. As an example, the start of a recession is defined as two consecutive quarters of negative GDP growth.
 Data Source: http://www.usgovernmentspending.com/ You can see that Debt declined as a percent of GDP after WWII until 1981, at which time National Income fell below National Spending, causing Budget Deficit. Economist tend to say that a country’s economy is on the verge of trouble when its debt reaches 90% of its GDP. That is where we are today. We were there during WWII and came out of it very nicely. Will we again? This doesn’t answer the question of what is a reasonable debt, but 90% of GDP is probably too high.
 Source: http://en.wikipedia.org/wiki/United_States_public_debt Who own all this debt? Who has loaned us money knowing that we will pay it back with interest, and we will. A US Treasury note is the safest investment in the world. Safer than stock, your local bank, or gold. The largest holder of Debt is the government itself, currently about 49% of the total. Most of this has been borrowed from the Social Security fund. The next largest holder of Debt is foreign governments. China owns 20.8% of internationally held Debt, which equates to about 10% of our total Debt. China doesn’t own the US yet. Japan is second, owning 9.2% of internationally held Debt, and ownership drops rapidly for other countries.
There isn’t much left to be borrowed from ourselves, so we will have to attract more outside loaners. This may require raising interest rates. This raises another issue, both economic and political.
It may cause the dollar to loose value on the world market. That will make foreign travel more expensive for Americans, and make our exports less expensive. This will increase demand in the US and create jobs. It will also cause the price of oil to rise. And it means we will pay back loans with less valuable dollars. Foreign countries will whine because they will be less competitive, and getting less return on their loans to the US. It’s all complicated.
In the next post I will get back to why we have so much deficit and debt, and look at the spending side of the budget. Paul will be exposed, but Peter has his coming too.
[print_link]
63% of American believe that the government spends more on defense and foreign aid than it does on Social Security and Medicare. Not true, and not even close if defense ($895B) is compared to mandatory ($2,166B) spending. The current argument in Washington is over cutting less than $100B from discretionary spending. The budget deficit is 12.7 times that amount, and the national debt is 130 times the maximum debated budget cut.
Budget Deficit and Public Debt is all the rage today in the media and political rhetoric. What is the data behind all the talk? Starting with this post I will share information, traceable to the Congressional Budget Office or The US Treasury, and my interpretation of the situation. The political and economic placing of blame and support of solutions will be assigned to the reader.
— *** —
The financial function of government is to take wealth from the public and redistribute to the public directly or through entities foreign and domestic. The question always before the public is, how much wealth to take and how to redistribute it.
The answer is driven by demand for services (defense, health, education, and welfare) and belief that those who can best afford to pay should (corporate tax, progressive income tax, excise, estate, and gift taxes).
The difficulty is that a service for Paul is a bill for Peter, and government is left to interpret the needs of Paul and willingness of Peter to pay.
The outcome has been to satisfy Paul through increased spending, and to placate Peter with reduced taxes, resulting in Federal deficit and debt.
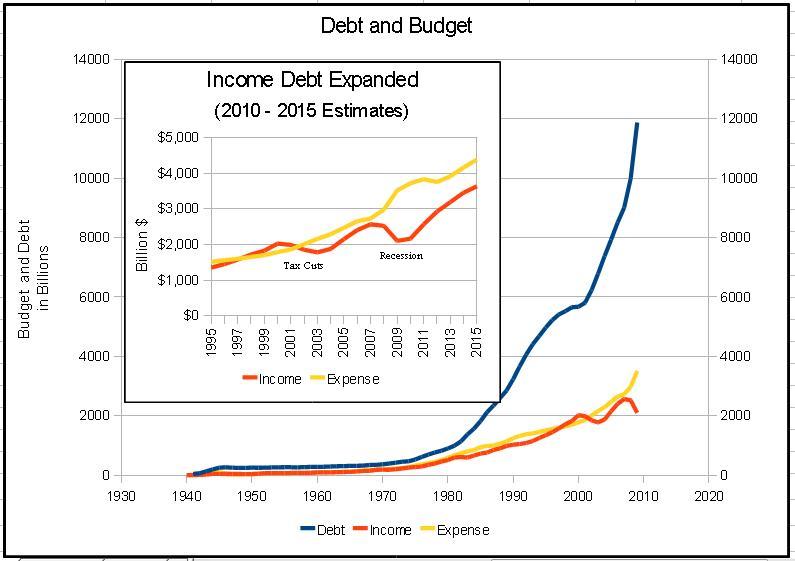
The problem is that the debt is increasing at an extraordinary rate that will eventually bankrupt the government if Paul and Peter don’t both make sacrifices to reduce it. Debt is the blue line approaching twelve trillion dollars in the chart below, while Deficit is the difference between Income and Expense.
 Data Source: http://www.usgovernmentspending.com/ Data Source: http://www.usgovernmentspending.com/
Debt has dramatically increased since 1975 to $12,311,349,677,512 in 2009, while Budget deficit has only been positive in 1998 through 2001. Each year’s budget deficit adds to the debt, just like at your house, but the debt growth exceeds the deficit. This is because of off budget spending (Supplemental Appropriations, $191 billion in 2009) and other spending that I can’t identify.
Paul (spending) and Peter (income) will both have to sacrifice in order to reduce debt to a manageable level because there is not enough flexibility on either side of the budget. See the 2011 proposed budget below.
 Chart Source: http://www.washingtonpost.com/wp-srv/special/politics/budget-2010/ Chart Source: http://www.washingtonpost.com/wp-srv/special/politics/budget-2010/
The currently proposed 2011 budget will pay $251 billion interest on the debt, while adding $1.27 trillion to the principle. Balancing the budget would require 33% reduction in spending or a 49% increase in income, and that is before any debt reduction can occur. Neither Paul or Peter alone can survive that degree of sacrifice.
If the Budget is to be balanced, Income must increase and Spending must decrease. We can’t continue with the proposal of faux presidential candidate Hugh Jidette, “Keep on spending and let our kids pick up the tab.” On the income side, personal and corporate income tax is the only area where a significant increase can occur. Balancing the budget by cutting expenses would wipe out all discretionary spending, and this is why mandatory spending cannot remain untouched in the future. I will cover both Income and Expenses in future posts.
In the next post I will look at the debt; who owns it — it’s not all China, and what is a reasonable amount of debt — it’s greater than zero.
[print_link]
|
|
 First note that annual GDP growth went negative for the first time in 60 years. Also observe that from 1950 to 1980 the trend in GDP growth was positive. Since 1980, the trend has been negative. This is very serious because GDP measures how robust the country’s economy is. Growth was mostly flat in the 90’s, which may have lulled us into thinking that things were swell, but until the trend turns positive, it will be hard sustain the life style we would like to become accustom to.
 More people are unemployed than in previous recessions, and they are staying jobless longer. This is compounded by higher paid manufacturing jobs are being replaced by lower paid service jobs. So, the worst recession ever drives income down and spending up just when the opposite is needed. Does this seem odd when US corporations profits are reaching record highs?


