I’ll start with Income instead of Spending. You have to have it before you can spend it, at least you should have. Each of us is both Peter and Paul. I receive Social Security, use libraries, and drive on public roads, while paying income tax and other taxes. For now I will focus on Peter and taxes. The Federal Government only taxes the flow of money (income, profits, and some spending). It doesn’t tax static assets like savings and property, but states tax property. The question is, where is the taxable income, how much can it be taxed, and at what point will taxing today’s personal income begin to reduce tomorrow’s Federal income. This last point gets the most debate; for instance, will extending tax breaks for the rich stimulate the economy or not?
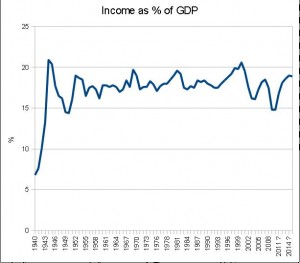
Where is the taxable income? The Income as % of GDP chart is important. It shows that Federal Income has maintained at about 18% of GDP. When GDP grows, Income grows. This is why the government is so motivated to improve the economy. If GDP were to grow an additional half percent, it would generate an additional $125 billion income. Not enough to solve the deficit problem. The deficit is too big to grow out of. So, lets tax more.
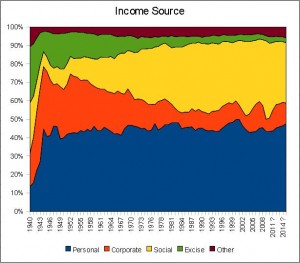
The Income Source chart shows how the source of income has changed over the years. Personal Income Tax has continued to provide about 40% of the total, while the Corporate Tax share has decreased. Further, the Social Tax share has increased. This is Social Security and Medicare/Medicaid. Note that since 2000 Income has decreased from 20% of GDP to 15%. This will have to reverse.
Give this some thought, the population has increased and resulted in more income tax payers. But, Baby Boomers are retiring at a growing rate. This means the high income earners are being replaced by lower income earners, resulting in lower income tax. I will leave the impact of this up to your analysis, but lets look at the tax payers.
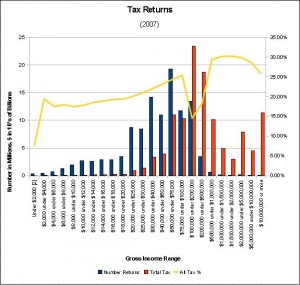
The number of tax returns peak at about 18 million in the $50k to $75k range. This distribution looks healthy, dropping off quickly in both directions. It would be less healthy if there was a high income peak and a low income peak with the gap in between showing the difference between “haves” and “have-nots”. Looks are deceiving, there are wider ranges at the top. There are twice as many tax returns below $75K as there are above. We can conclude that the most votes are in the lowest income ranges also. Now, where is the most Federal income earned? The greatest tax income ($230 billion) comes from the $100k to $200k range. A little math shows that those returns above $75k equal 4.5 times the tax revenue of those below. The wealthy provide more of the Income tax revenue than the less wealthy.
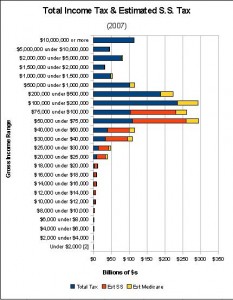
But, what about Social Security and Medicare Taxes? The line showing tax as a percentage of income includes these social taxes. The dip to 14.5% occurs in 2007 because S.S. tax was not paid on earned income above $97,500. The Social Taxes are estimates based on the tax rates and include the employer matching contribution, because the employer contribution could have been personal income if not collected as tax. It’s hard to make estimates in the high income ranges because Social Taxes are collected on earned income, not interest and dividends. The next chart shows the sum of a personal taxes, and it’s clear that the mid income ranges contribute the most.
Back to the original questions, where can we tax more? Eliminate the limit on Social Security taxable income. Professional athletes would have to pay S.S. tax through the year beyond their first $106,800 of earnings. It’s hard to argue that those earning more than $200,000 can’t afford to pay more, and it may be accomplished by making the Medicare tax rate progressive instead of fixed at 1.45% in addition to increasing high income tax rates. Will increased taxes dampen the economy and slow job growth? That risk has to be balanced against the need to balance the budget and reduce the deficit.
What about corporate taxes? No more charts, US corporate income tax ranges from 15% to 35% of taxable income, and Colorado corporate taxes are 4.63%. So, a sizable business in Colorado pays about 40% tax compared to about 25% in China. US corporate taxes are the highest in the world. Others are in the area of 30%. Corporate taxes throughout the world are very complex, but the point is clear: 40% vs 25%. There isn’t much more Federal or state income to be extracted from corporations without hurting their competitiveness and US economy.
In the next post I will look at spending.
[print_link]


Leave a Reply